A remote sensing segmentation method successfully applied by the Tour du Valat
Identifying the distribution and layout of natural habitats in the landscape is a key step in the implementation of biodiversity conservation policies. Managing an estate of nearly 2,700 hectares, the Tour du Valat has been developing research programmes on Mediterranean wetlands and innovative management methods for many years. In 2018, within the framework of preparing the next management plan, the Estate’s natural habitats were mapped using a new, semi-automatic method combining segmentation, photointerpretation, and localised phytosociological sample plots as an alternative to completely manual methods.
MAPPING REQUIREMENTS
Fourteen years after the previous study[1], it seemed necessary to update the mapping work, provide tools and a method that could easily be reproduced for subsequent studies, and inventory the current state of the Estate’s plant communities in accordance with existing official typologies (Natura 2000 and EUNIS (European Union Nature Information System)). A tool for assisting and supporting management decisions about habitats, these maps will enable their long-term monitoring by reproducing the method proposed.
SEGMENTATION METHOD APPROACH
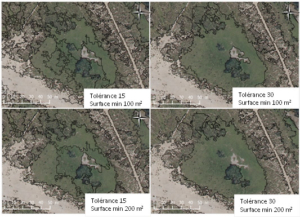
The computerised process used to segment the Colour (Red, Green, Blue) (BD Ortho®RVB IGN) and IRC (near-InfraRed false Colour) (BD Ortho®IRC, IGN) orthophotos (50 cm 2017) automatically grouped adjacent pixels with similar spectral characteristics into segments.
The study used the GUI v1.4.8[2] and ArcGISTM 10.4 (2015) software tools of the wetland remote-sensing and mapping system GEOclassifier, developed in the framework of the SWOS project (Satellite-based Wetland Observation Service), The segmentation settings[3] can be modified in function of requirements and the expected use of the maps:
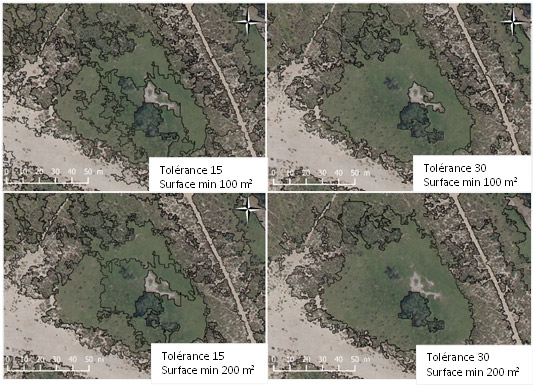
Tolerance: groups pixels in segments in function of their spectral characteristics.
Minimum mapping surface area: determines the minimum size of segments
The vector layer is then integrated into ArcGIS to allocate the polygons to a habitat type.
HETEROGENEOUS DISTRIBUTION OF HABITATS
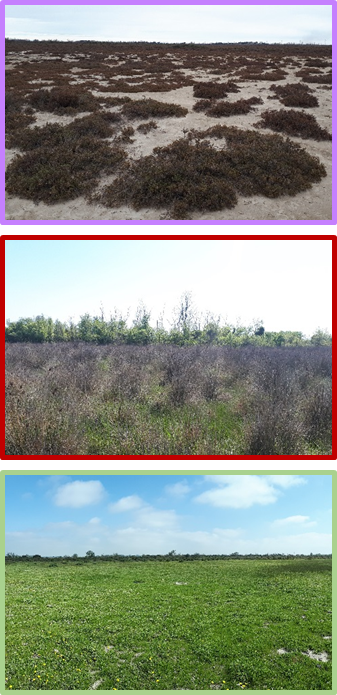
The Tour du Valat’s habitats are complex and very heterogeneous, and include temporary ponds, marshes, riverine dunes, and large expanses of salt meadow.
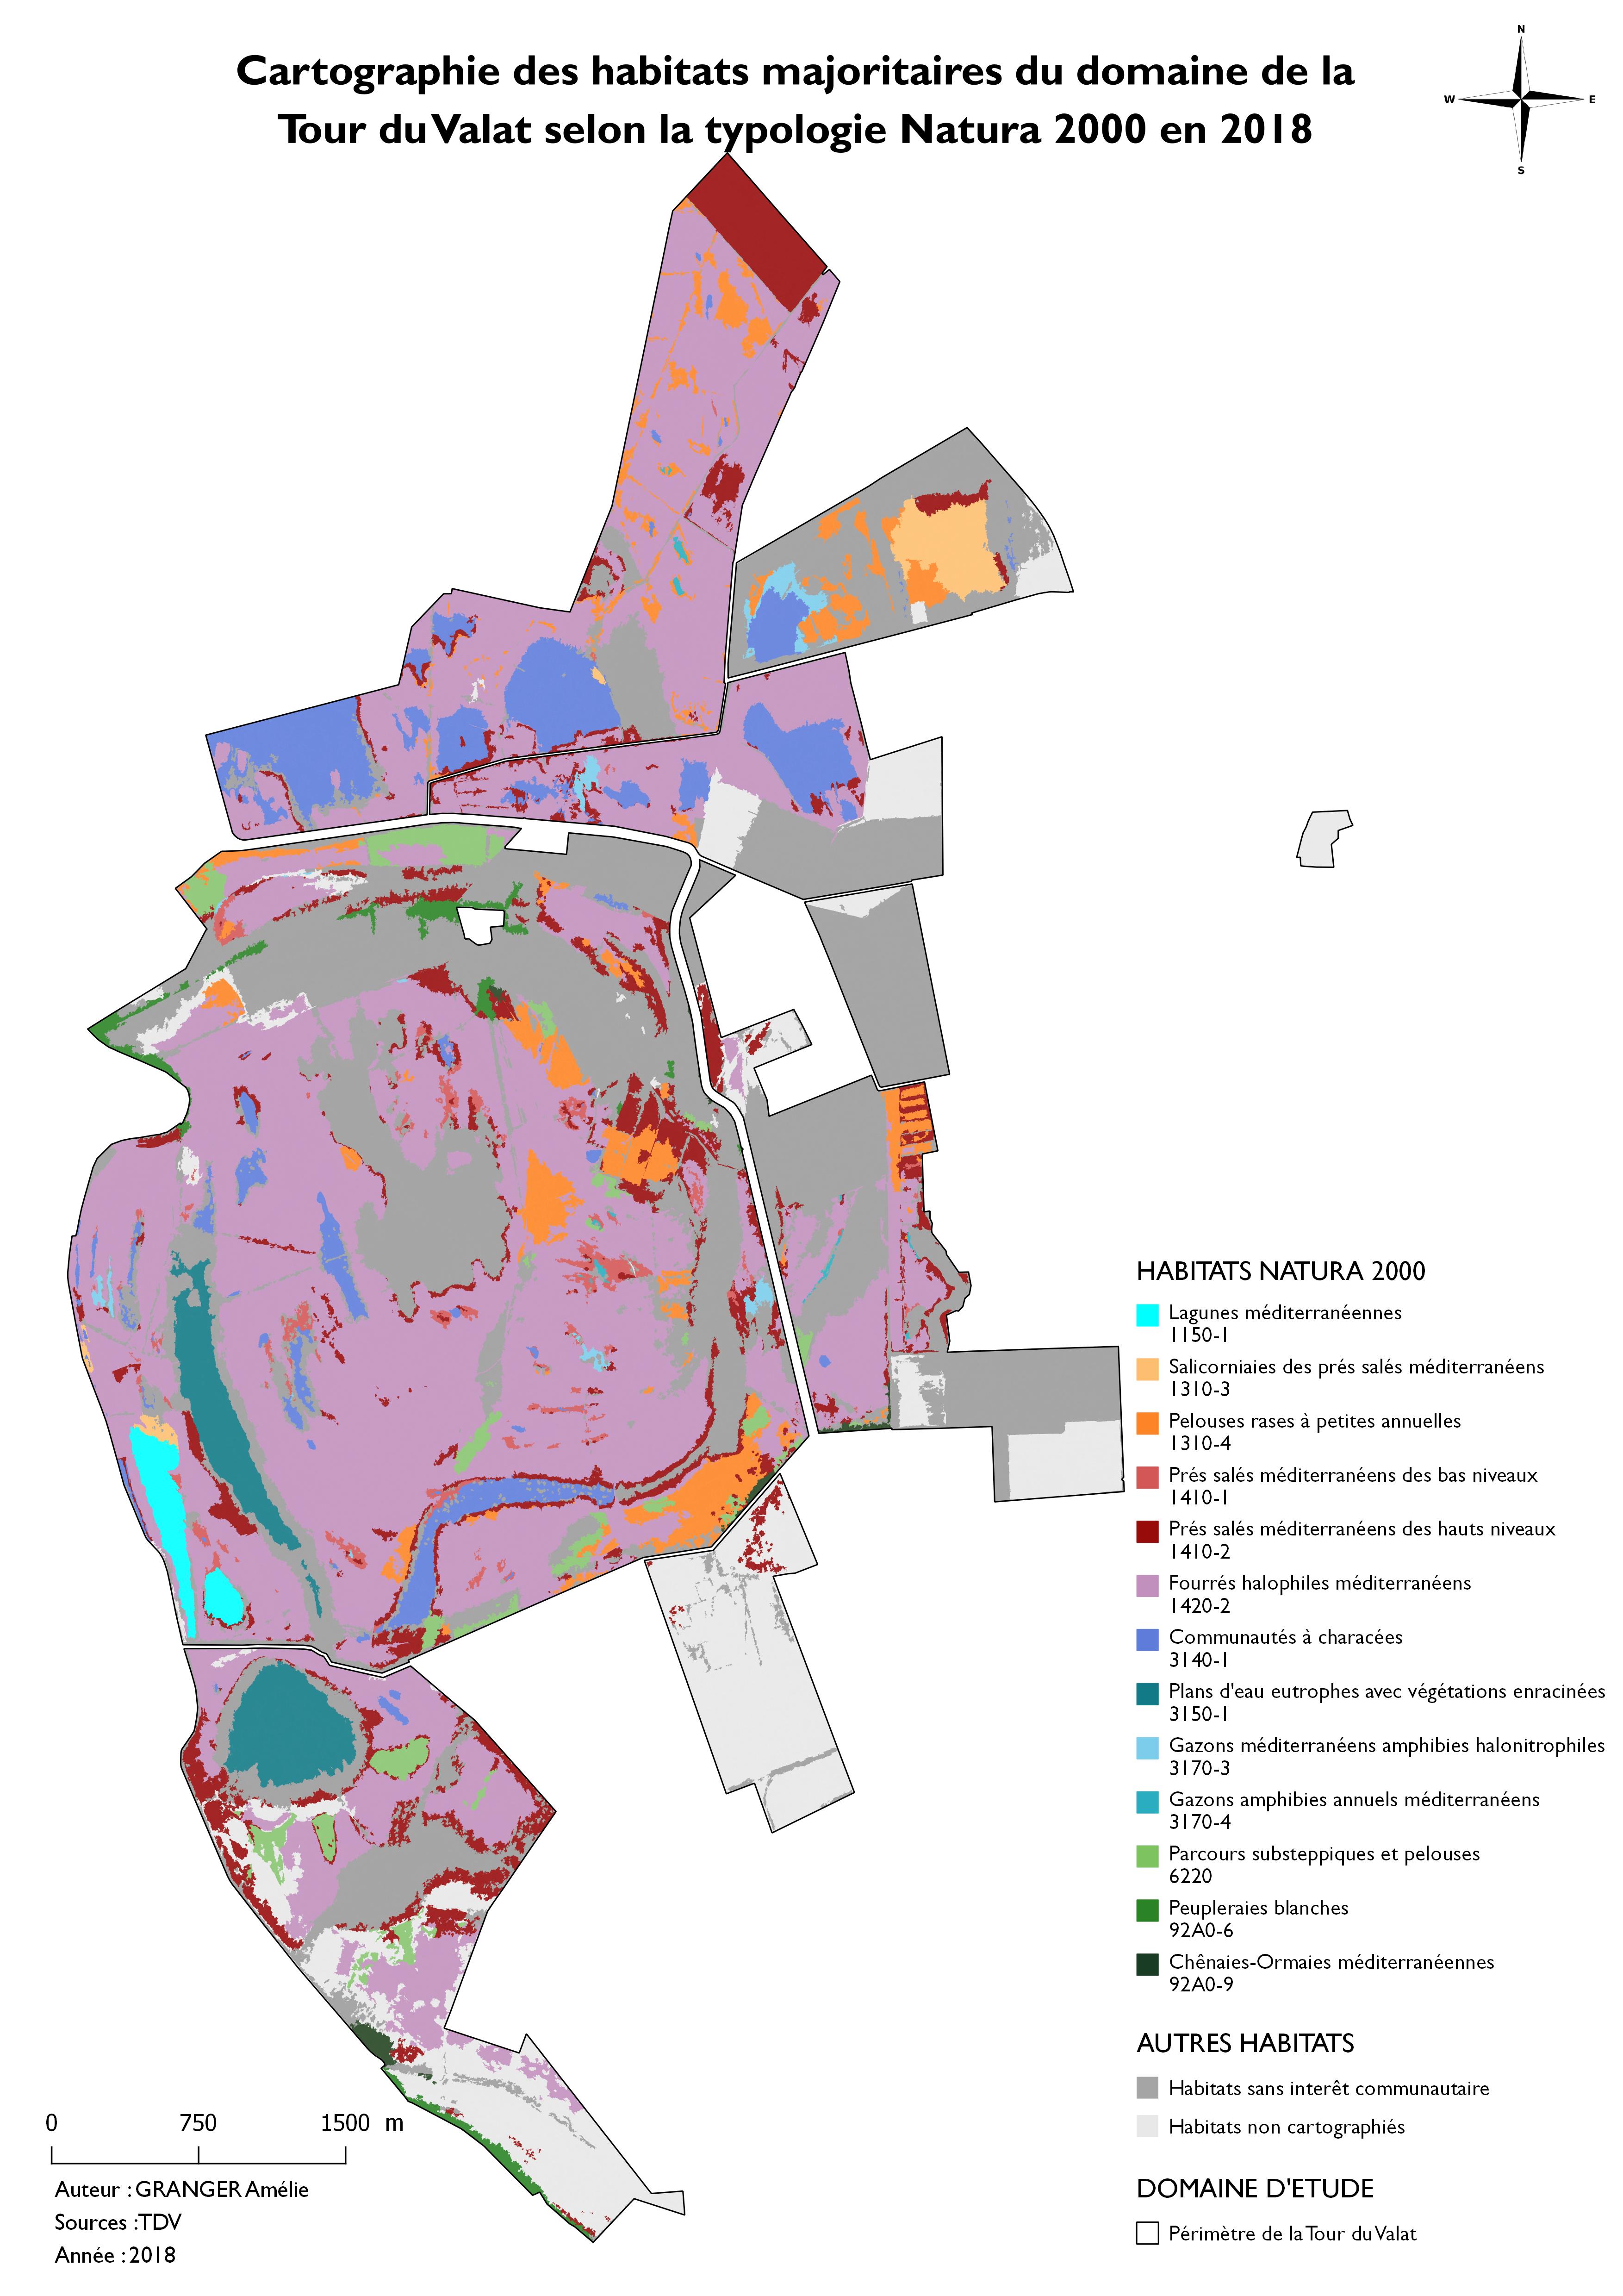
The work carried out in 2018 produced a modified list of the habitat types found on the Estate: 9 habitat types of community interest were identified including 3 priority habitats (amongst which the newly listed Habitat 1150-2* Mediterranean Coastal Lagoons), and a set of habitat types not categorised in the EU Habitats Directive.
The maps drawn up provide a representation of the spatial distribution of habitats based on photointerpretation of the orthophotos and field relevés. Plant communities dominated by Mediterranean halophilous scrub vegetation cover 43.2% (978.9 ha) of the surface area already mapped in 2018 (2,267.5 ha). Next come upper and lower Mediterranean salt meadows that cover 8.4% (XXX), West Mediterranean tamarisk thickets that cover 6.1% (137.4 ha), and areas of hard oligo-mesotrophic waters with benthic vegetation of Chara species communities that cover 5.8% (130.9 ha).
|
© A. Granger |
Click to zoom |
COMPARISON OF METHODS
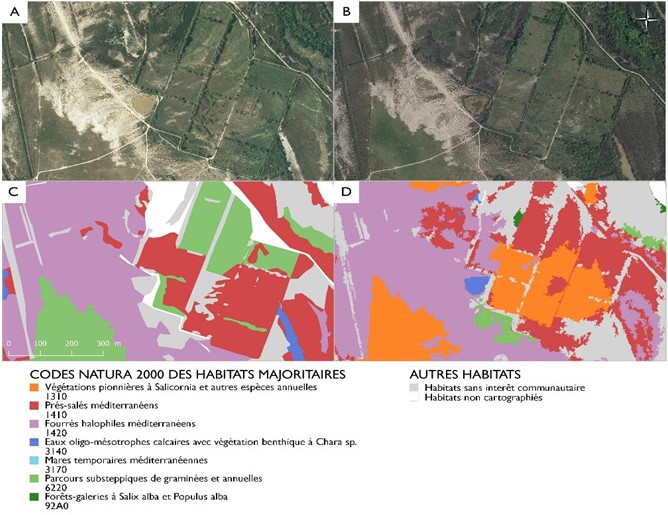
In addition to the major differences in habitat interpretation between the two years, the method tested in 2018 requires less work time and provides much more precise mapping contours. Based on the comparison of habitats of community interest according to the Habitats Directive, the ratio between the perimeter and the surface area (P (Km))/S (Ha)) of each polygon is significantly more accurate in the 2018 mapping, and the total perimeter measured is 2.6 times more accurate by segmentation than by digitalisation (see Figure above).
Nevertheless, the study carried out at the Tour du Valat did have some limitations: a visually heterogeneous segmentation of habitats, the generation of a very large number of polygons with the selected settings, and difficulties with the photointerpretation of habitats or plant successions due to the use of single-date orthophotos.
MAPS SUITABLE FOR ASSISTING DECISION-MAKING
The customisable settings of the GEOclassifier GUI software application enable users to produce results that are appropriate for the mapped area and their intended uses. High-precision maps can serve as tools for managers to assist or support decision-making in order to perform the long-term monitoring facilitated by the reproducibility of the segmentation method.
A team made up of four people (estate manager, botanists, GIS specialist) worked together to achieve this very fine-scale map of natural habitats. The work required considerable botanical skills for the plant surveys and full mastery of the GIS[4] (Geographic Information System) software.
While the time spent identifying the polygons produced by the segmentation process was largely dependent on the complexity of the habitats (vegetation heterogeneity, structure, phenological growth stage, etc.), the ArcGIS tools enabled very easy and rapid selection of neighbouring entities belonging to a given habitat type.
Author: Amélie Granger, Master 2 – Land-use Planning and Remote Sensing, Paul Sabatier University – Toulouse III, e-mail [2]
- Contacts
Amélie Granger’s internship manager: Damien Cohez, manager of the Tour du Valat RNR, e-mail [3]
Monitoring of natural habitats: Hugo Fontès, plant ecology research engineer, e-mail [4]
Segmentation method: Anis Guelmami, head of the GIS, remote-sensing and mapping project at the Mediterranean Wetlands Observatory (Tour du Valat), e-mail [5]
[1] [6] Dangre C. (2004). Diagnostic des habitats naturels du domaine de la Tour du Valat (Camargue, Bouches du Rhone). Définition d’enjeux et prospections d’action de gestion.
[2] [7] Acquisition of the licence and open-source software by direct request to the partner organisation developing it (JenaOptronik) via the SWOS project website: http://swos-service.eu [8] E-mail [9]
[3] [10] The orthophotos are 8-bit coded, and 256 shade values can be attributed to each colour channel. Tolerance defines the maximum accepted difference in these values in each segment. It depends on the type of image and the desired size of the segments. Minimum mapping surface area is coded by number of pixels in GEOclassifier GUI.
[4] [11] ArcGIS, QGIS